(first published in O'Reilly Radar)
In addition to utilizing the global sensor network to access realtime, current, and future weather, we can also use these sources to project the effects of the weather across a wide spectrum of human activities. As such, satellite remote sensing has become an indispensable tool for researchers in the Earth observation community.
Remote sensing is just what the name implies: a suite of tools for accessing information about a subject without actually "touching" it. Remote sensing devices range from your own eyes to satellites in orbit hundreds of miles above the surface.
Many of these Earth-orbiting satellites are in continuous data acquisition and transmission mode, capturing everything from ocean temperatures, to land reflectance at the surface of the Earth, to global chlorophyll production. Each of these satellites is equipped with a variety of instruments, which collect very specific segments of information contained in the various bands of the electromagnetic spectrum. Users then, depending on their area of interest, will take the digital data and construct profiles of their study area, analyzing individual or composite band data and building time series profiles so that these databases can start to tell a story.
One of the most common multispectral analyses uses information derived in the near infrared and visible (red) spectral regions, called the Normalized Difference Vegetation Index, or NDVI, which can be viewed as a "greenness index." The higher the value on the scale, the more photosynthetically active the surface vegetation is, which can be used as an indicator of vegetation health. Whether the objective is to assess the health of crops in a specific growing region or across an entire continent, this index is a good indicator of how a crop region may be progressing, and where appropriate, crop failures can start to be identified. This year, the NDVI was used as an important proxy for agricultural health in India as the image below shows.
Within the graphic, the smaller image to the left shows the NDVI in July of 2009, and the smaller image on the right is the index one year later.
India is a country where agriculture and related industries make up a large part of domestic economic activity, and is therefore largely dependent on the health of the annual monsoon rains. This is not just for those directly involved in agriculture -- the nation's agrarian base consists of millions of independent farmers, who are the primary consumers of the goods purchased by the secondary industries, such as automobiles and motor scooters. So a poor monsoon not only means the potential for food shortages and less revenue for farmers, it also means less income to support other segments of India"s economy.
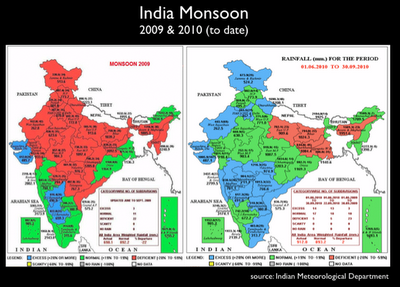
In 2009, the Monsoon was officially declared a "failure" (see image below left) as seasonal rainfall totals for the country came in 22 percent below normal. In the midst of a poor global macroeconomic picture, the lack of rains last year could not be repeated. This year has produced a much better monsoon (below right), and fortunately, Weather Trends clients were able to make longer range decisions with this forecast in mind. While 2010 is not a complete recovery, as India's north eastern states are still low, the pattern has been much more beneficial to the agricultural sector in the central and southern states.
Just receiving more rain does not necessarily mean economic recovery, so we look to the NDVI to measure the change. As we can see, the year-over-year images reflect the better ground conditions with the "greenness" across central and southern India indicating better crop potential.
The NASA Ocean Color Web is a treasure trove of research-grade data that can be used to analyze these environmental variables, and combinations of these data sources can lead to the construction of new indices that may be used an stand-alone analyses, or for incorporation into longer time series models.


No comments:
Post a Comment